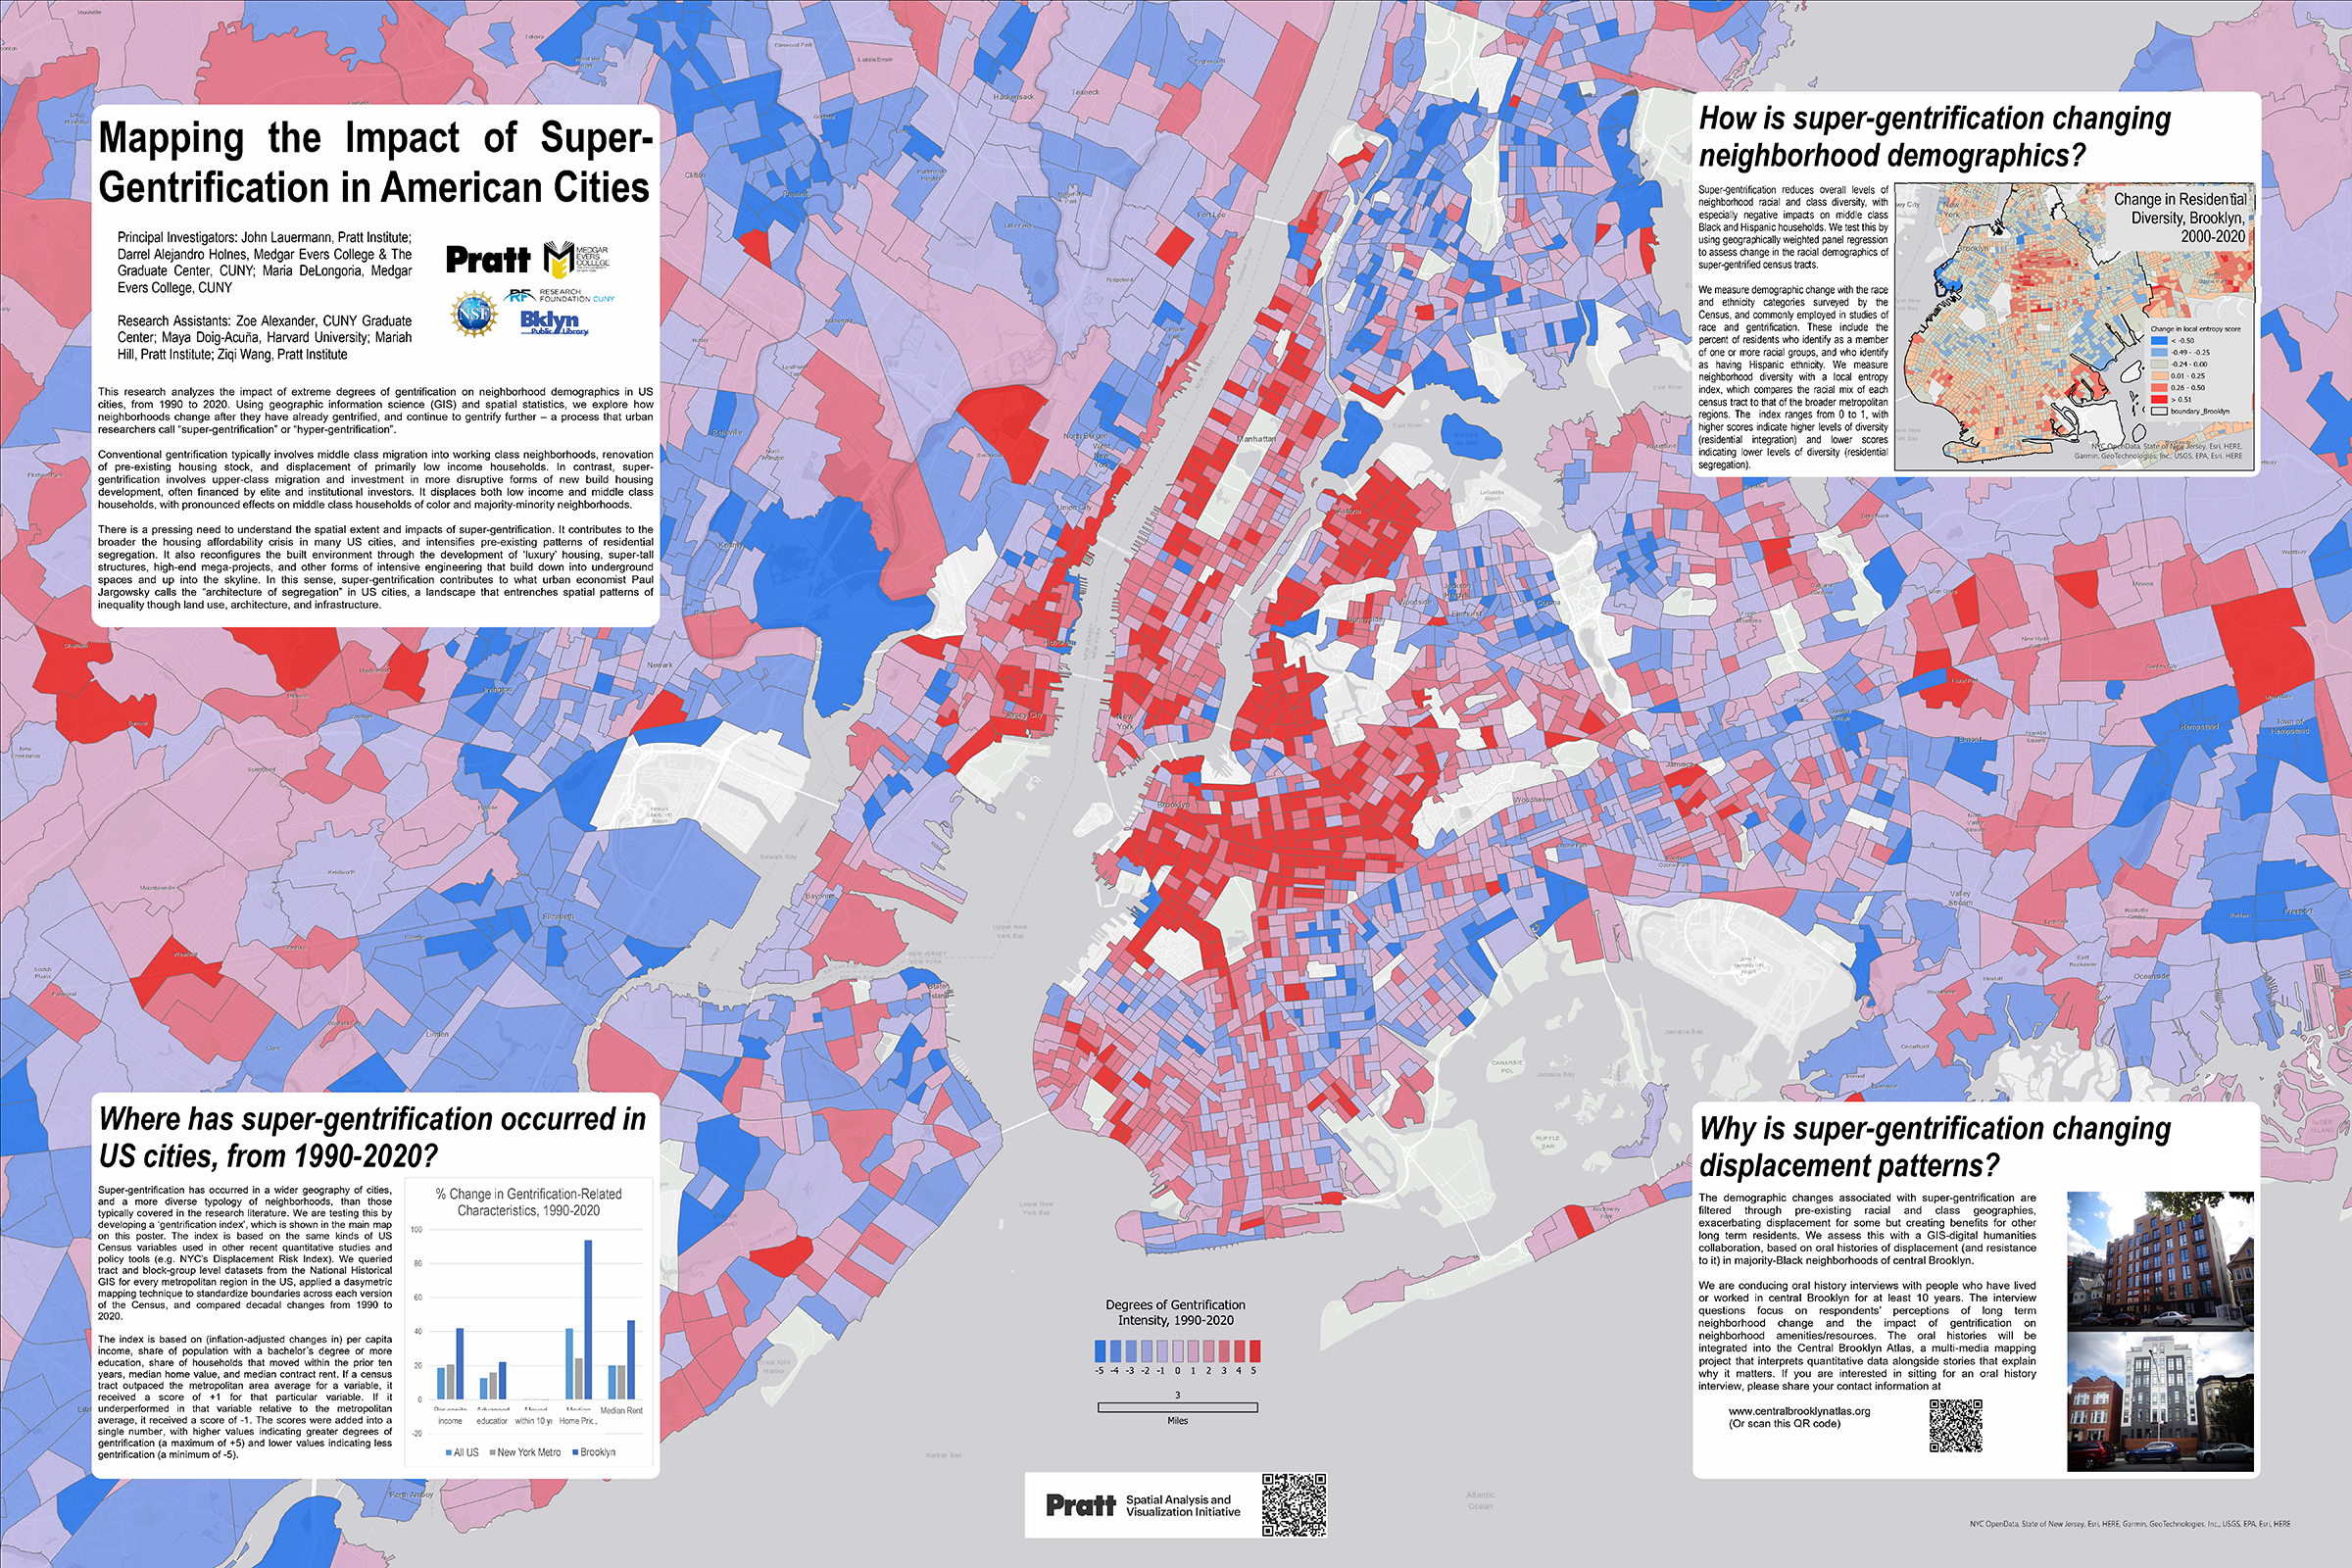
Mapping the Impact of Super-Gentrification in American Cities
National Science Foundation; Research Foundation of CUNY; & Brooklyn Public Library
This research analyzes the impact of extreme degrees of gentrification on neighborhood demographics in US cities, 1990-2020. Using geographic information science (GIS) and spatial statistics, we explore how neighborhoods change after they have already gentrified, and continue to gentrify further – a process that urban researchers call “super-gentrification” or “hyper-gentrification.”
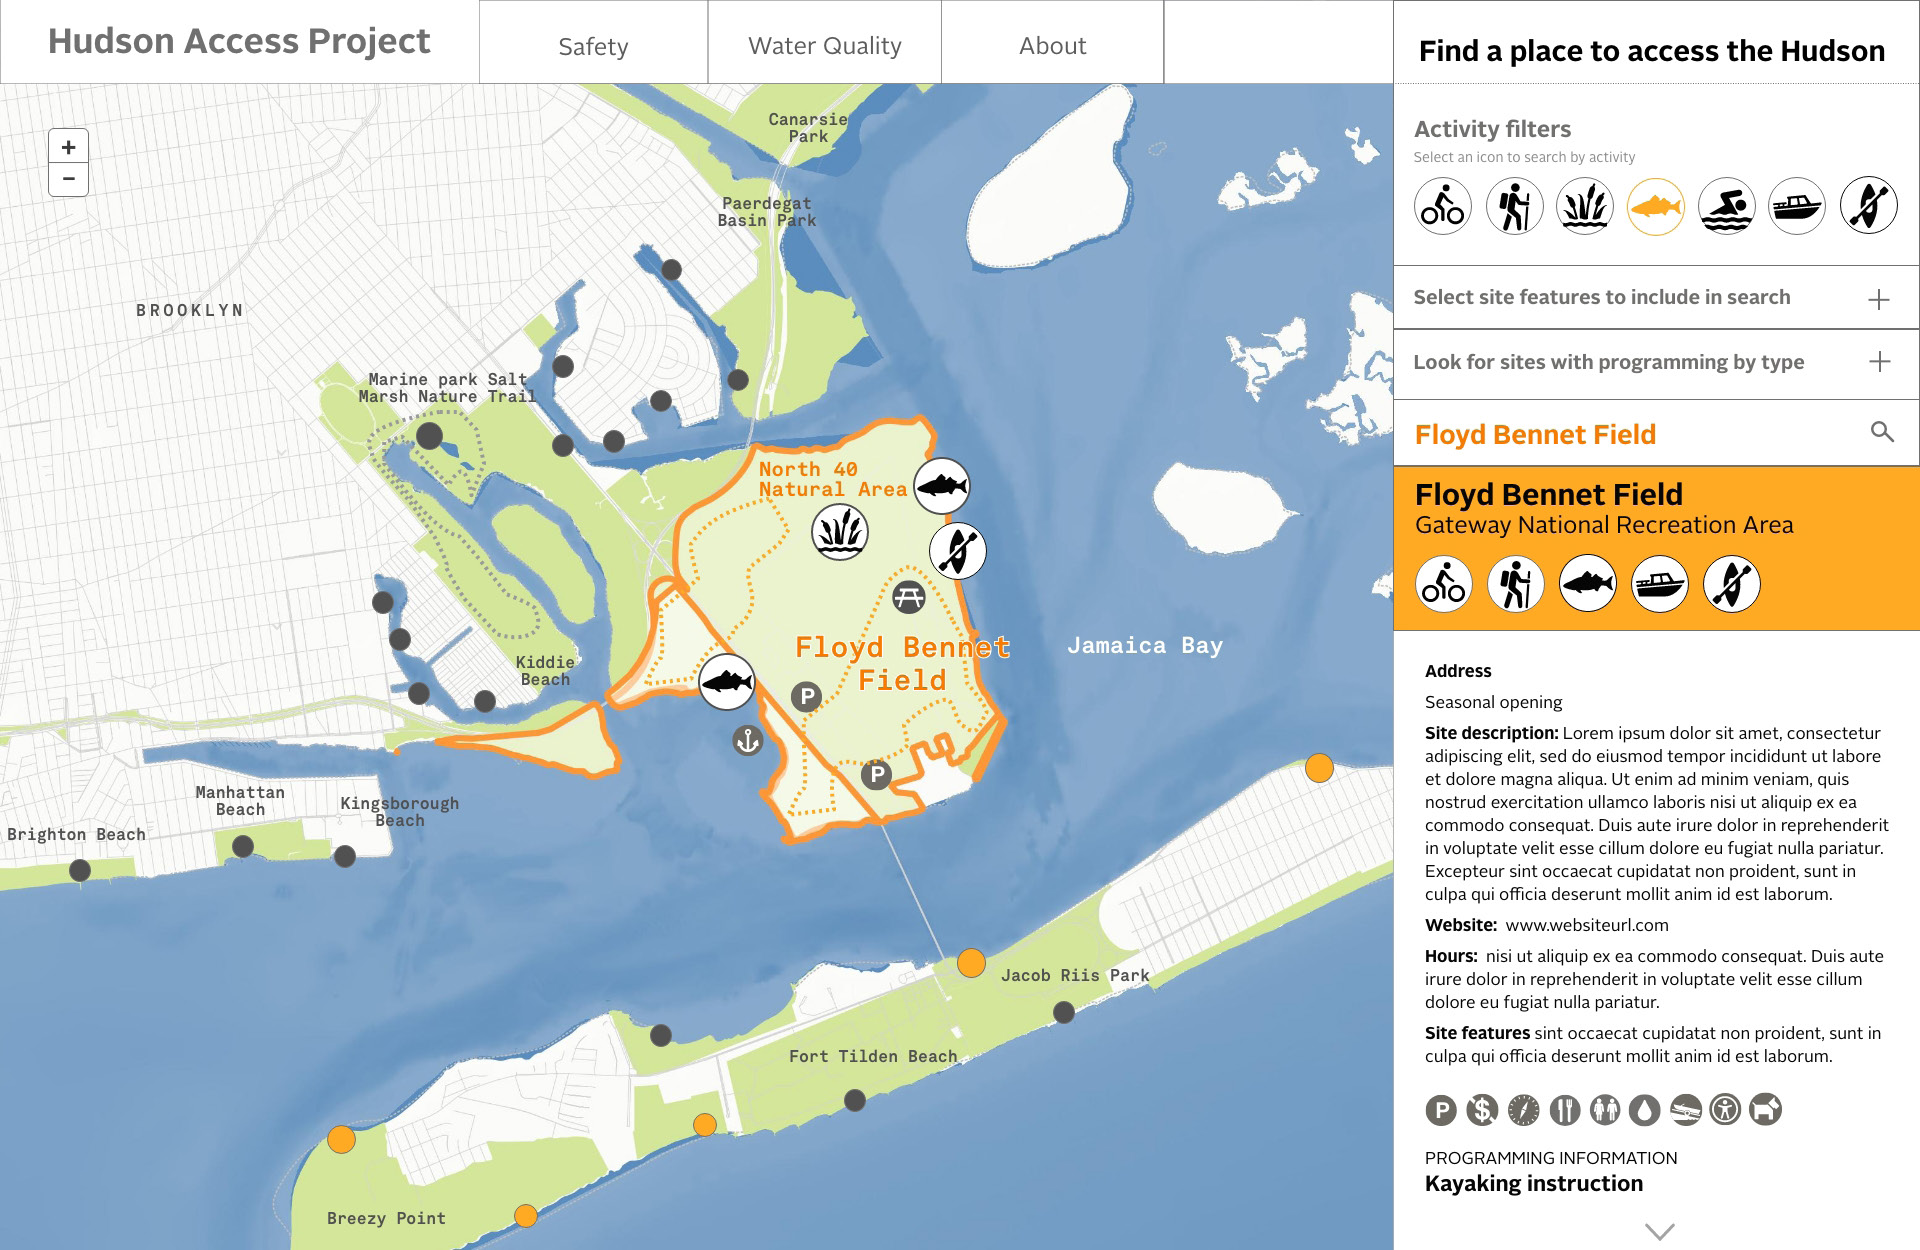
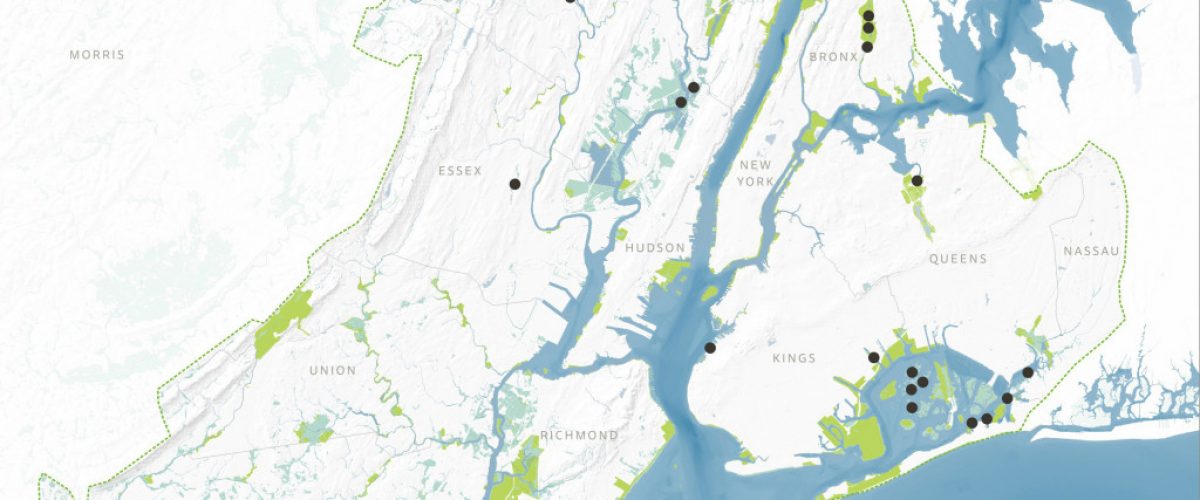
Hudson Access Project
NY-NJ Harbor and Estuary Program; New York State Department of Environmental Conservation; Riverkeeper; & Save the Sound
Expanding on the NYC Paddling Guide created in 2021, the Hudson Access Project (HAP) is creating a public access inventory database and interactive map to provide New Yorkers with comprehensive, up-to-date information, encouraging recreation in and on the Hudson River.
Who Takes Care of New York?
New York City Urban Field Station – USDA Forest Service, NYC Department of Parks and Recreation
‘Who Takes Care of New York’ explores the variety of civic groups that exist in New York City, and the ways that they care for their local environments. Displayed through maps, art, and storytelling, this exhibition aims to empower visitors with an understanding of their capacity to make lasting changes in their neighborhoods.
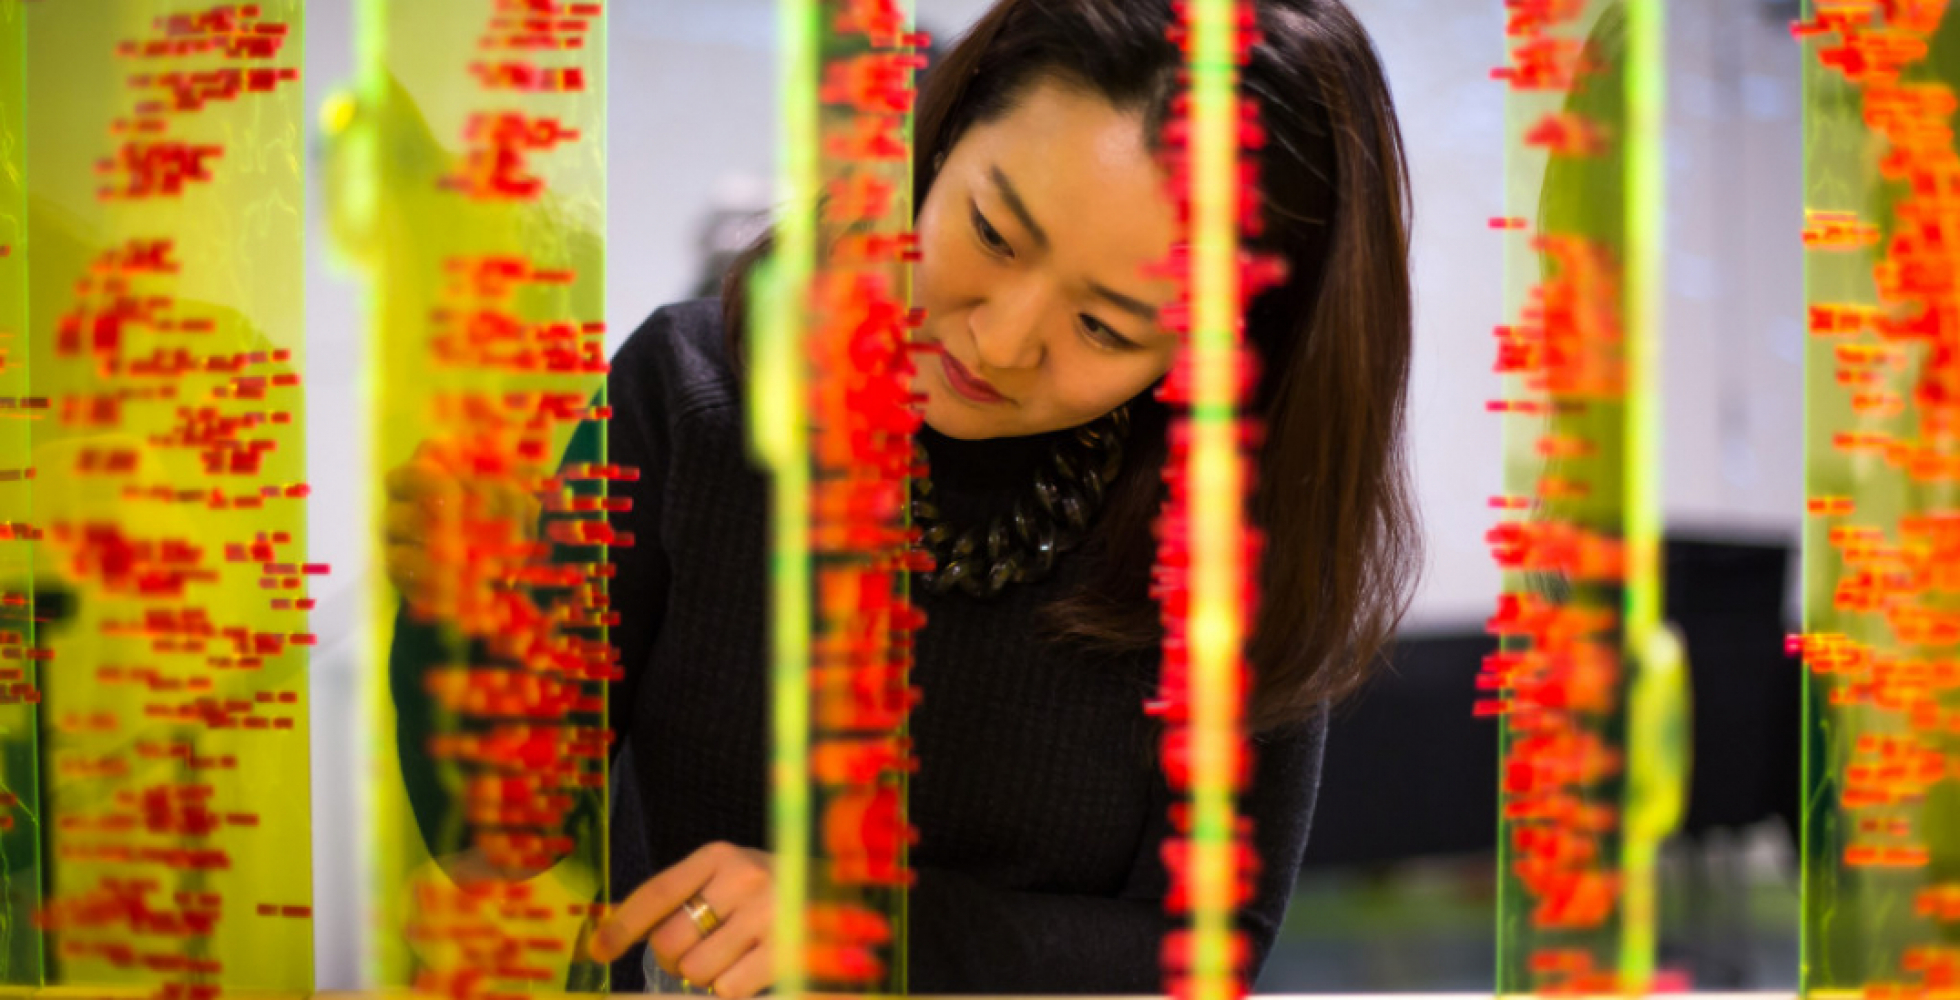
Data Through Design, Alternative Cartography Exhibit
NYC Mayor’s Office of Data Analytics; Made in NY Media Center by IFP; Brown Institute for Media Innovation at Columbia University; Carto; & Enigma
Data Through Design is an annual alternative cartography and art exhibition held during New York City’s Open Data Week, an endeavor of the Mayor’s Office of Data Analytics.
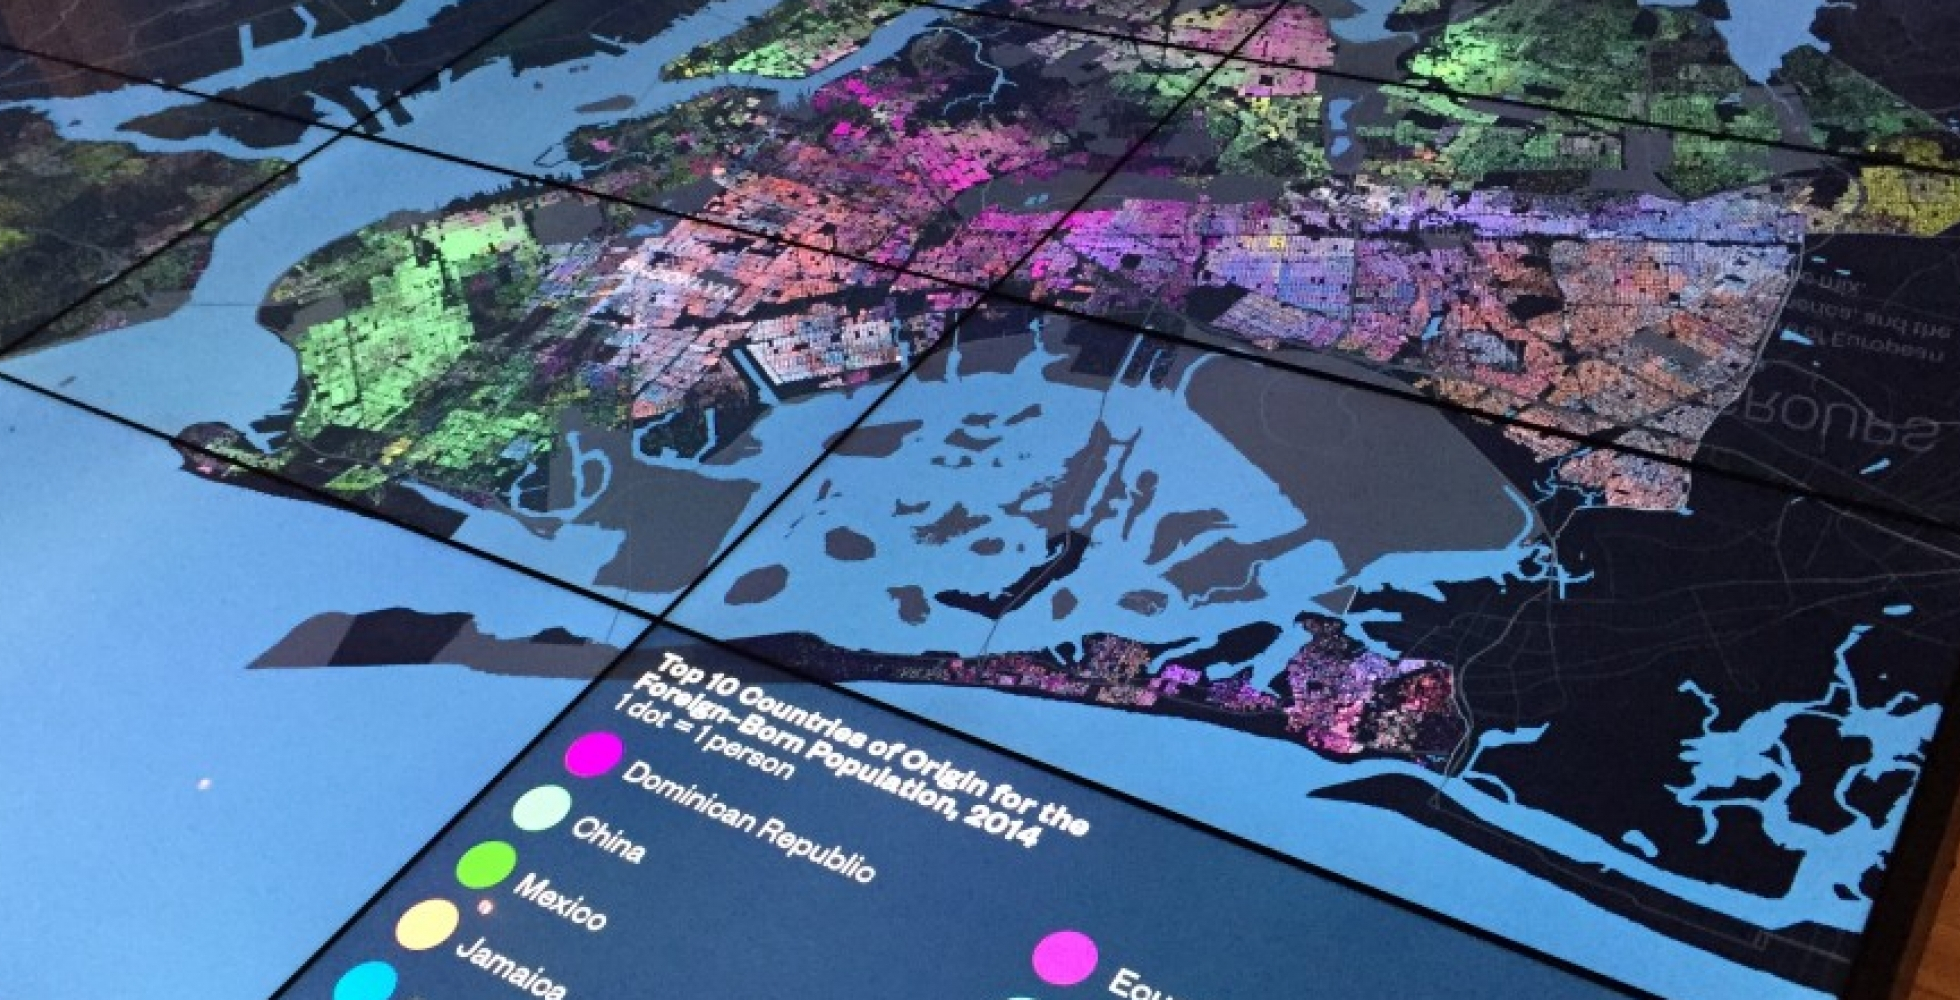
Museum of the City of New York – Mapping NYC 2000-2050, Future City Lab Gallery, New York at Its Core Exhibit
Museum of the City of New York
SAVI performed data analysis and mapping for the Museum of the City of New York’s (MCNY) first permanent exhibition, New York at Its Core. The exhibit presents the dramatic 400-year history of New York City as well as a high-tech look at the future.
NY-NJ Harbor & Estuary Program / Hudson River Foundation
NY-NJ Harbor & Estuary Program (HEP) & Hudson River Foundation
The Pratt Institute Spatial Analysis and Visualization Initiative and Sara Eichner collaborated to design and create a visual identity and design system for a series of five reports in print and online, and a collection of interactive graphics for the NY-NJ Harbor & Estuary Program (HEP).
Hester Street Collaborative for the New York City Department of Cultural Affairs
Hester Street Collaborative
SAVI was honored to be part of the CreateNYC team that, through months of community engagement and research, crafted a cultural plan for New York City. SAVI researched and curated data from a range of public and private sources to understand how New Yorkers access arts and culture.
M-LAB / Mohenjo-Daro
Laboratory for Integrated Archaeological Visualization and Heritage
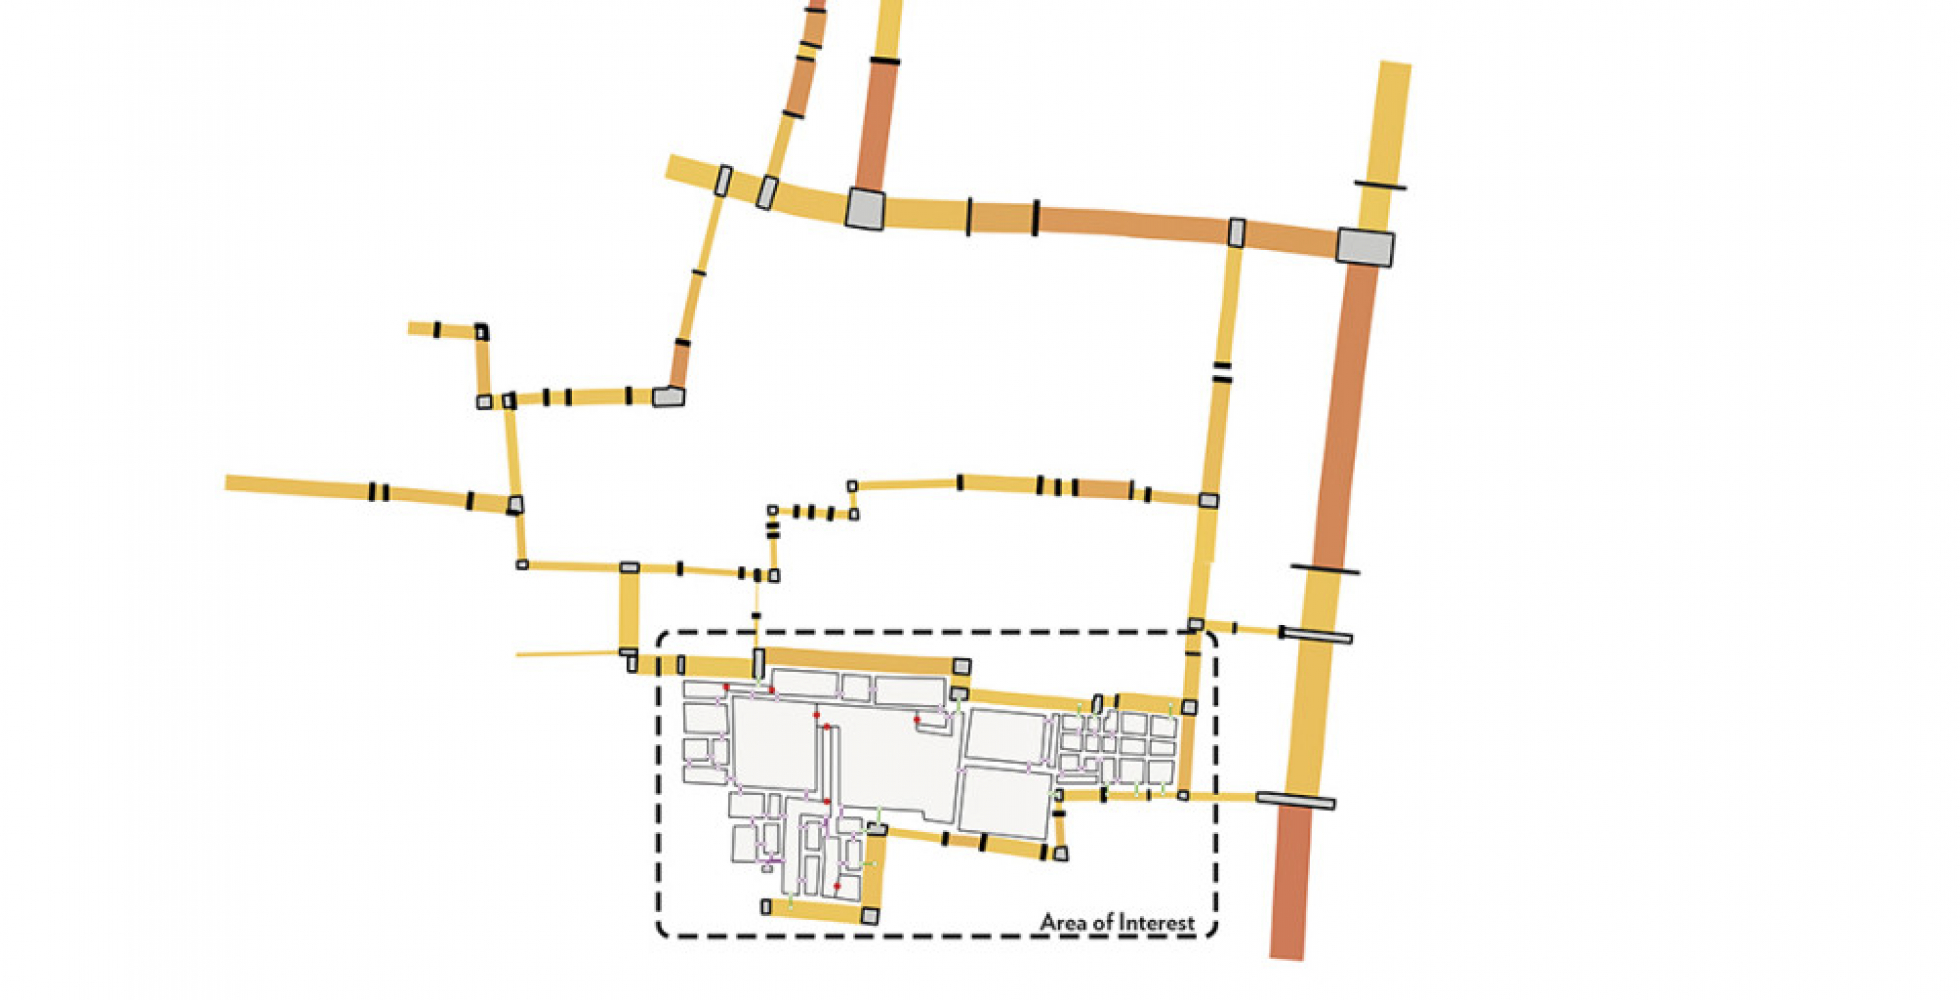
M-LAB is the inaugural project of the Laboratory of Integrated Archaeological Visualization and Heritage (LIAVH), connecting multidimensional archaeological data to detailed 3D site models for the 3rd millennium BCE, World Heritage Site of Mohenjo-Daro, Pakistan. This project builds software allowing for visualization of multiple strata, artifacts, and architecture through time.
Neighbors Allied for Good Growth – ToxiCity Map
North Brooklyn Neighbors (formerly Neighbors Allied for Good Growth)
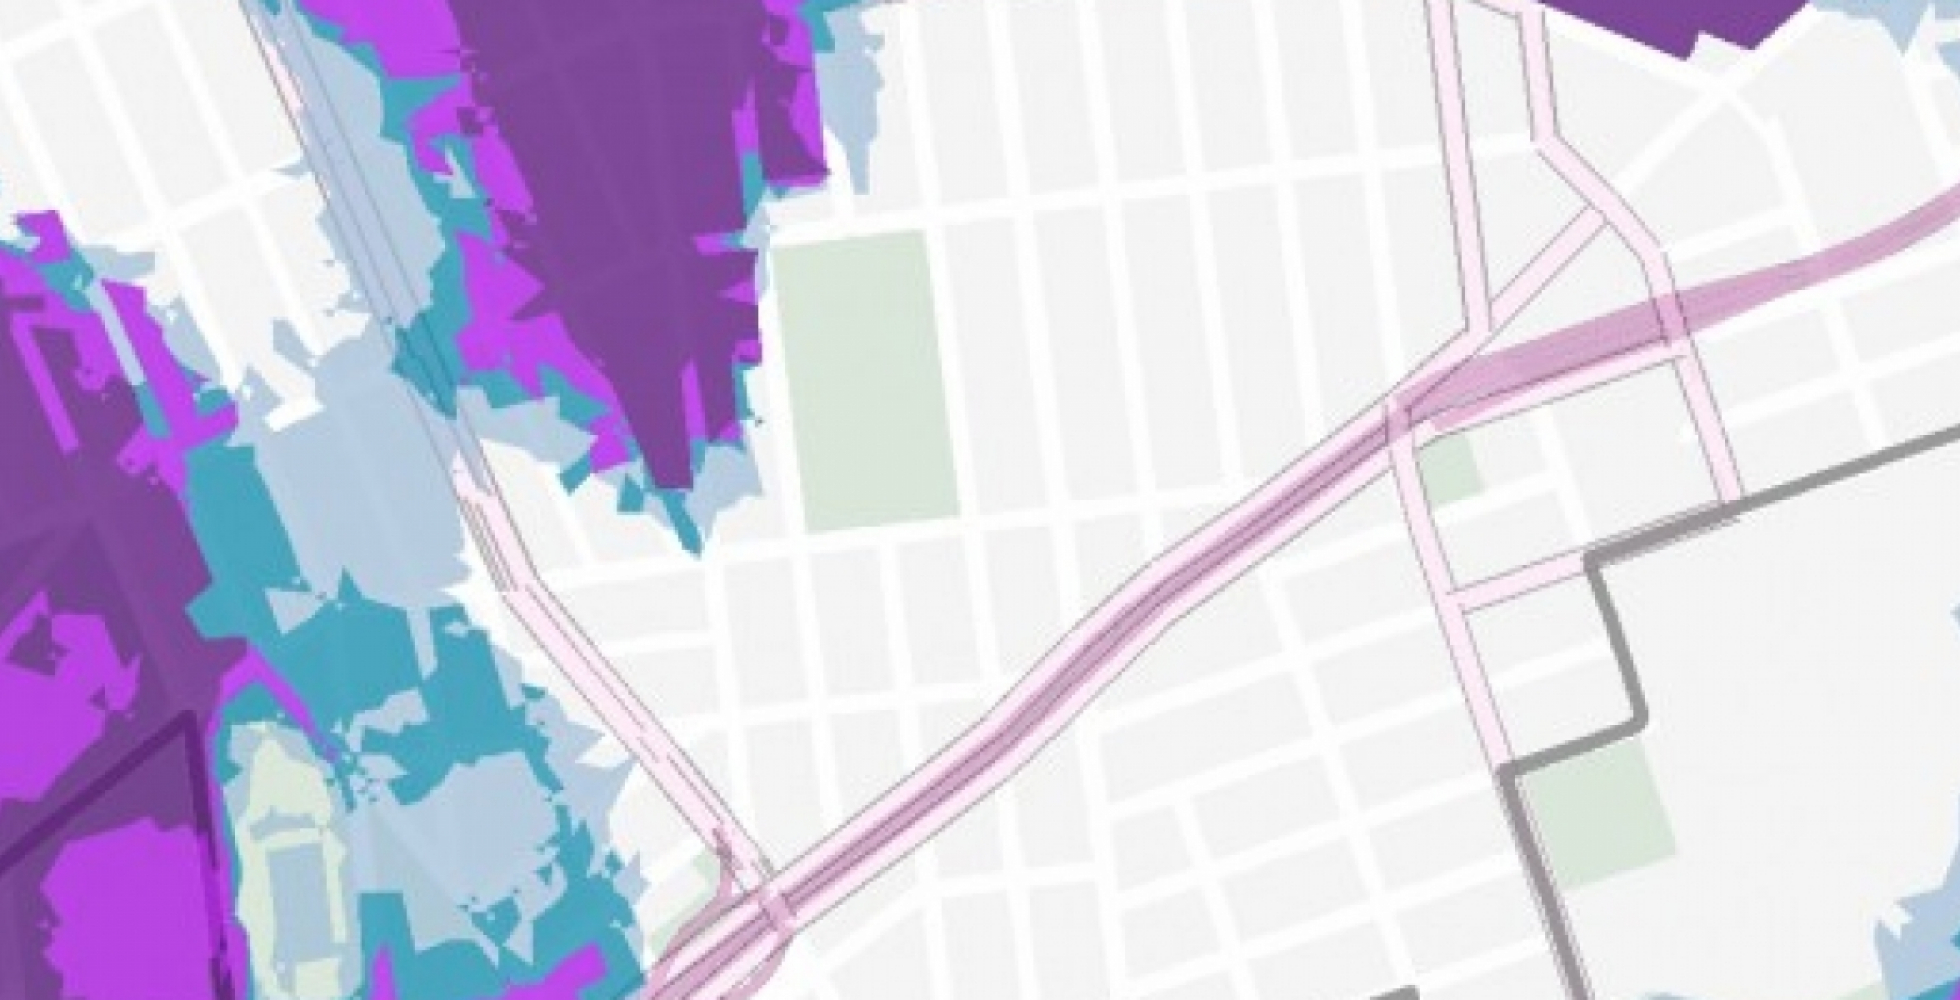
In the Brooklyn communities of Greenpoint and Williamsburg, Neighbors Allied for Good Growth (NAG) aims to recapture the waterfront, reduce local environmental hazards, and advocate for public policies promoting healthy mixed-use communities. NAG enlisted SAVI to determine the extent of pollution that has occurred throughout the history of Greenpoint and Williamsburg.
Cuba GIS Education
CUJAE & Plan Maestro
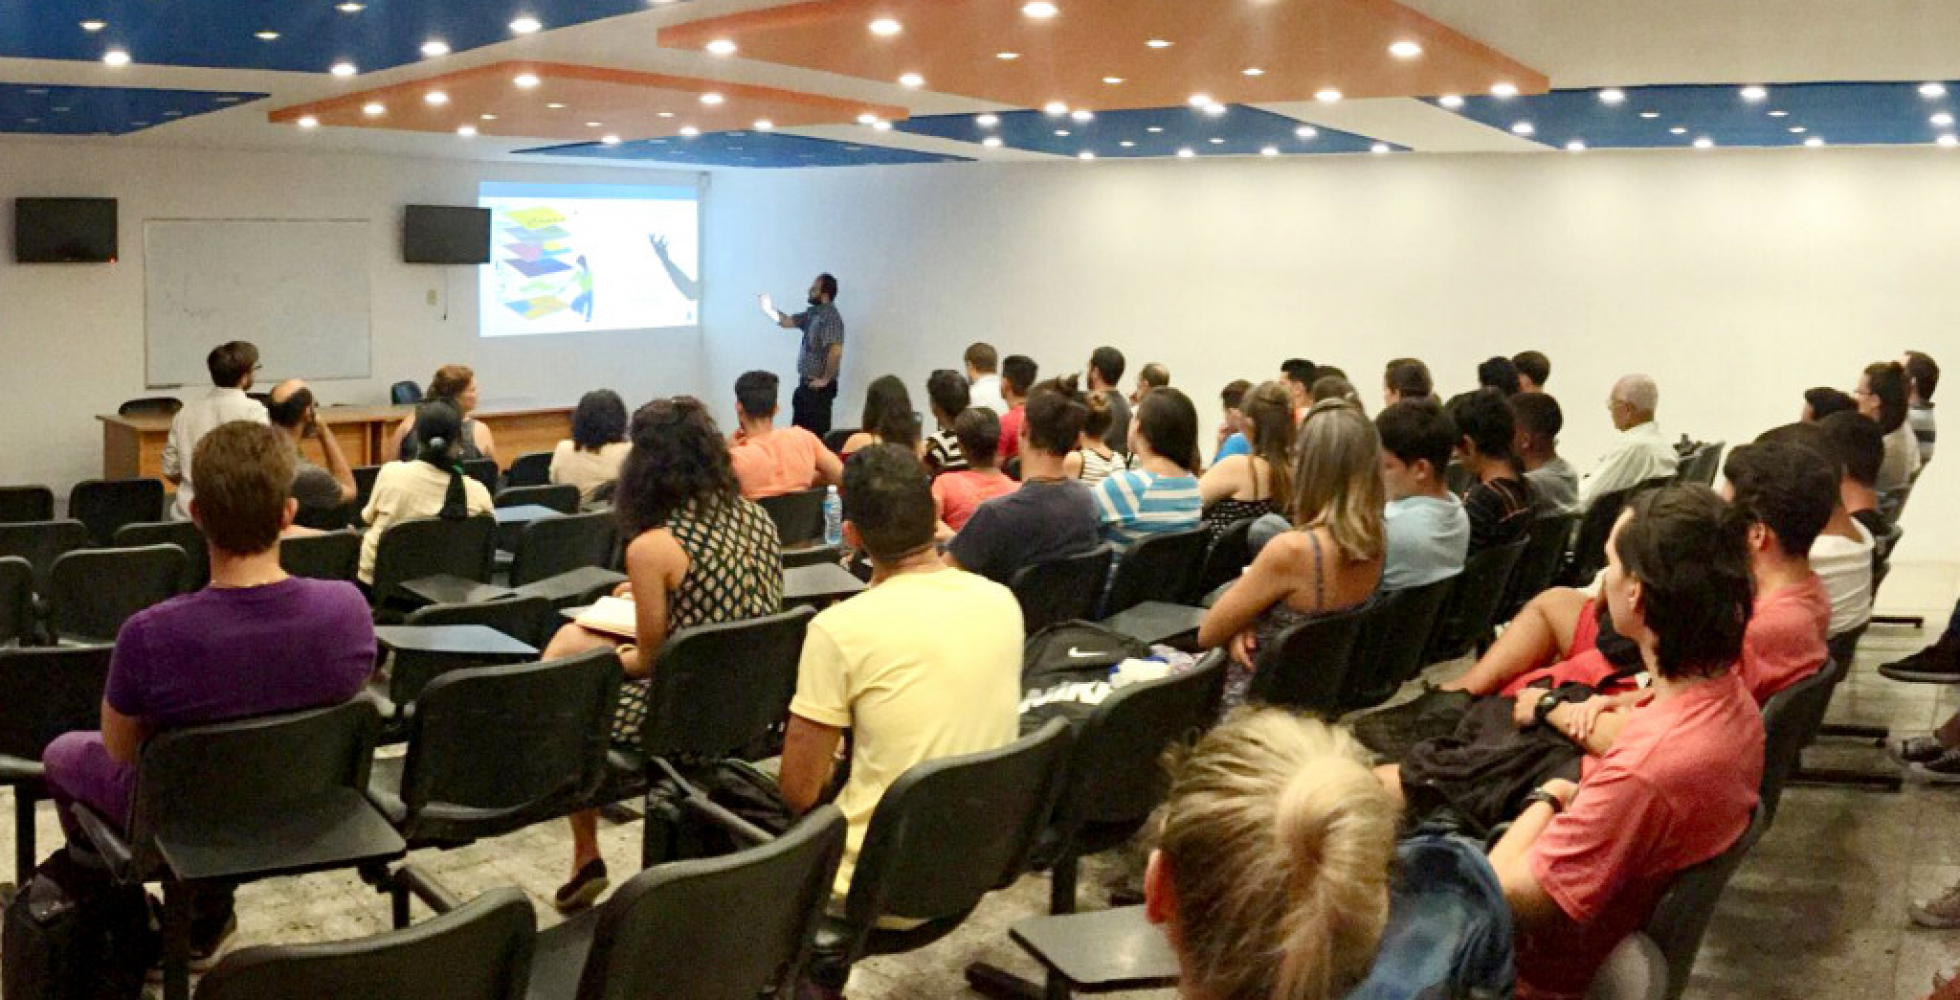
SAVI and its team of five experts spent two weeks in Havana, Cuba in May and June of 2018 conducting multi-day GIS training workshops for CUJAE, the Jose Antonio Echeverria Technological University of Havana, Cuba’s main architecture school; and Plan Maestro, the planning division of the Office of the Historian of the City of Havana.
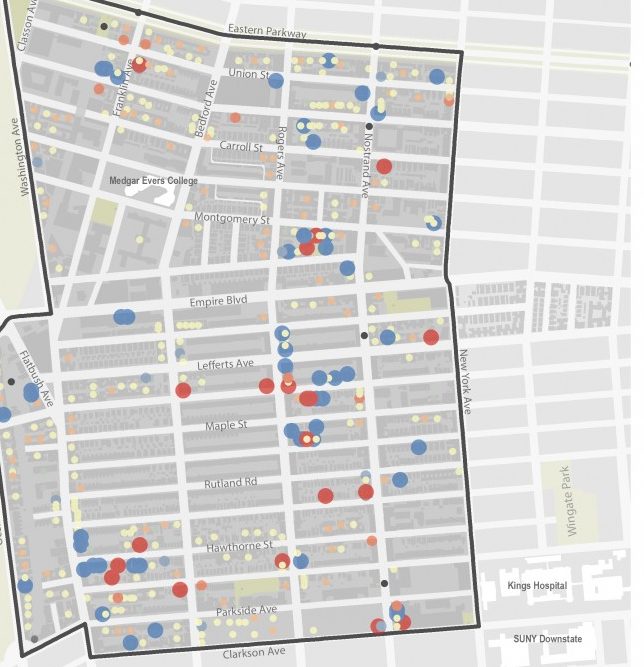
Collective for Community, Culture and the Environment for Prospect Lefferts Gardens Neighborhood Association
Collective for Community, Culture and the Environment
SAVI created maps and charts of neighborhood data for Prospect Lefferts Gardens to enhance the Collective for Community, Culture and the Environment’s project with the neighborhood association.
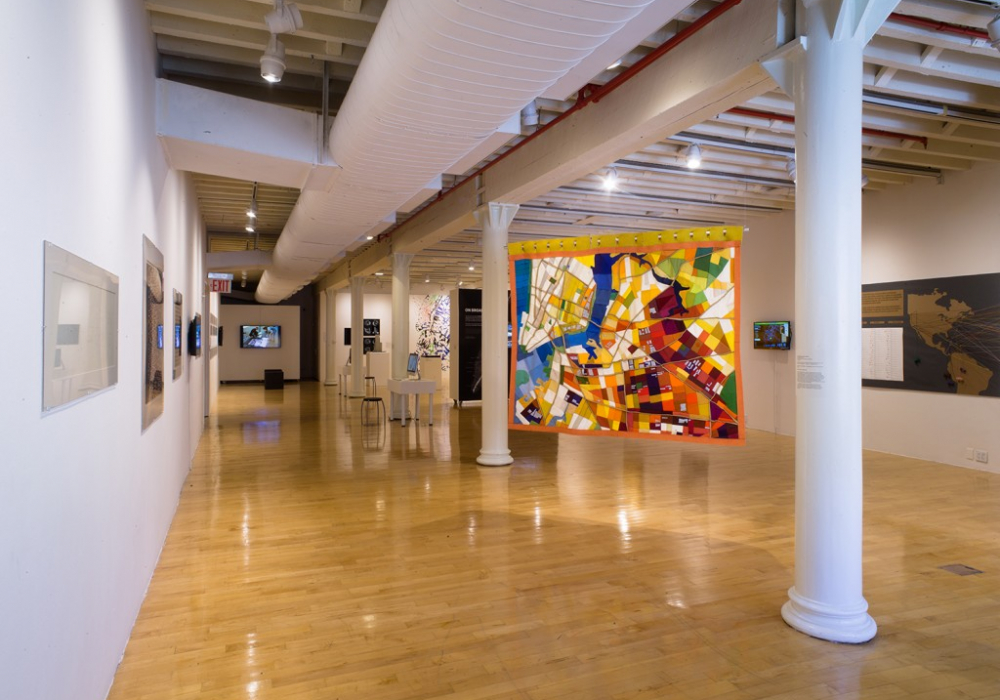
You Are Here – NYC: Art, Information, and Mapping Exhibit
Pratt Manhattan Gallery
In September 2017, Pratt Manhattan Gallery presented You Are Here – NYC: Art, Information, and Mapping, an exhibition of works demonstrating the artistic side of cartography. Curated by Katharine Harmon, author of numerous books on creative mapping, and Jessie Braden, director of SAVI, the exhibit showcased map art based on data analysis and visualization.
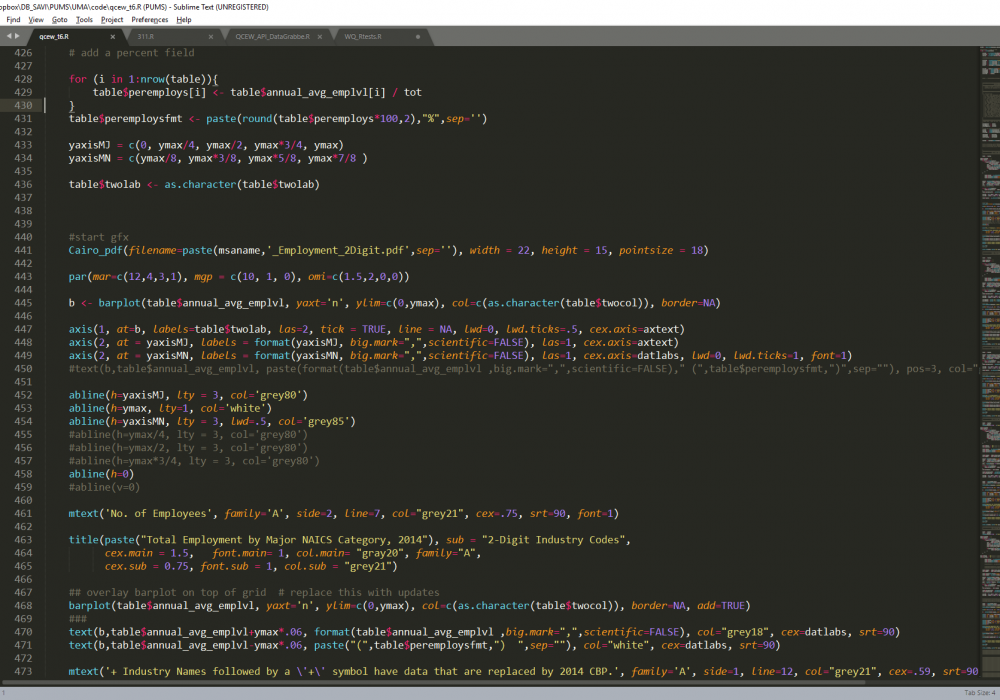
Urban Manufacturing Alliance
Urban Manufacturing Alliance (UMA) & Pratt Center for Community Development
In 2017 UMA undertook a comprehensive research project, “The State of Urban Manufacturing” to understand the shifts, growth and distribution of manufacturing in sixteen metropolitan areas. SAVI was brought on in partnership with the Pratt Center for Community Development to programmatically process this information into a series of charts and figures.
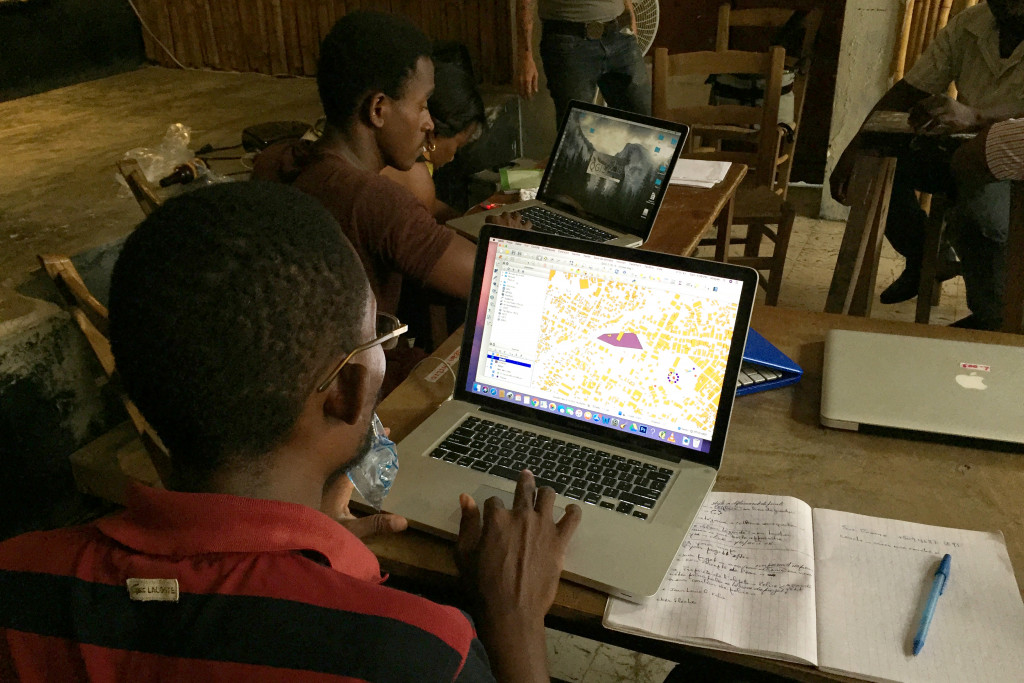
Haiti GIS Education
Jakmel Ekpresyon Community Center & Bard College
SAVI traveled to Haiti in August of 2018 to teach a one-week mapping course at the Jakmel Ekspresyon (JE) Community Center.
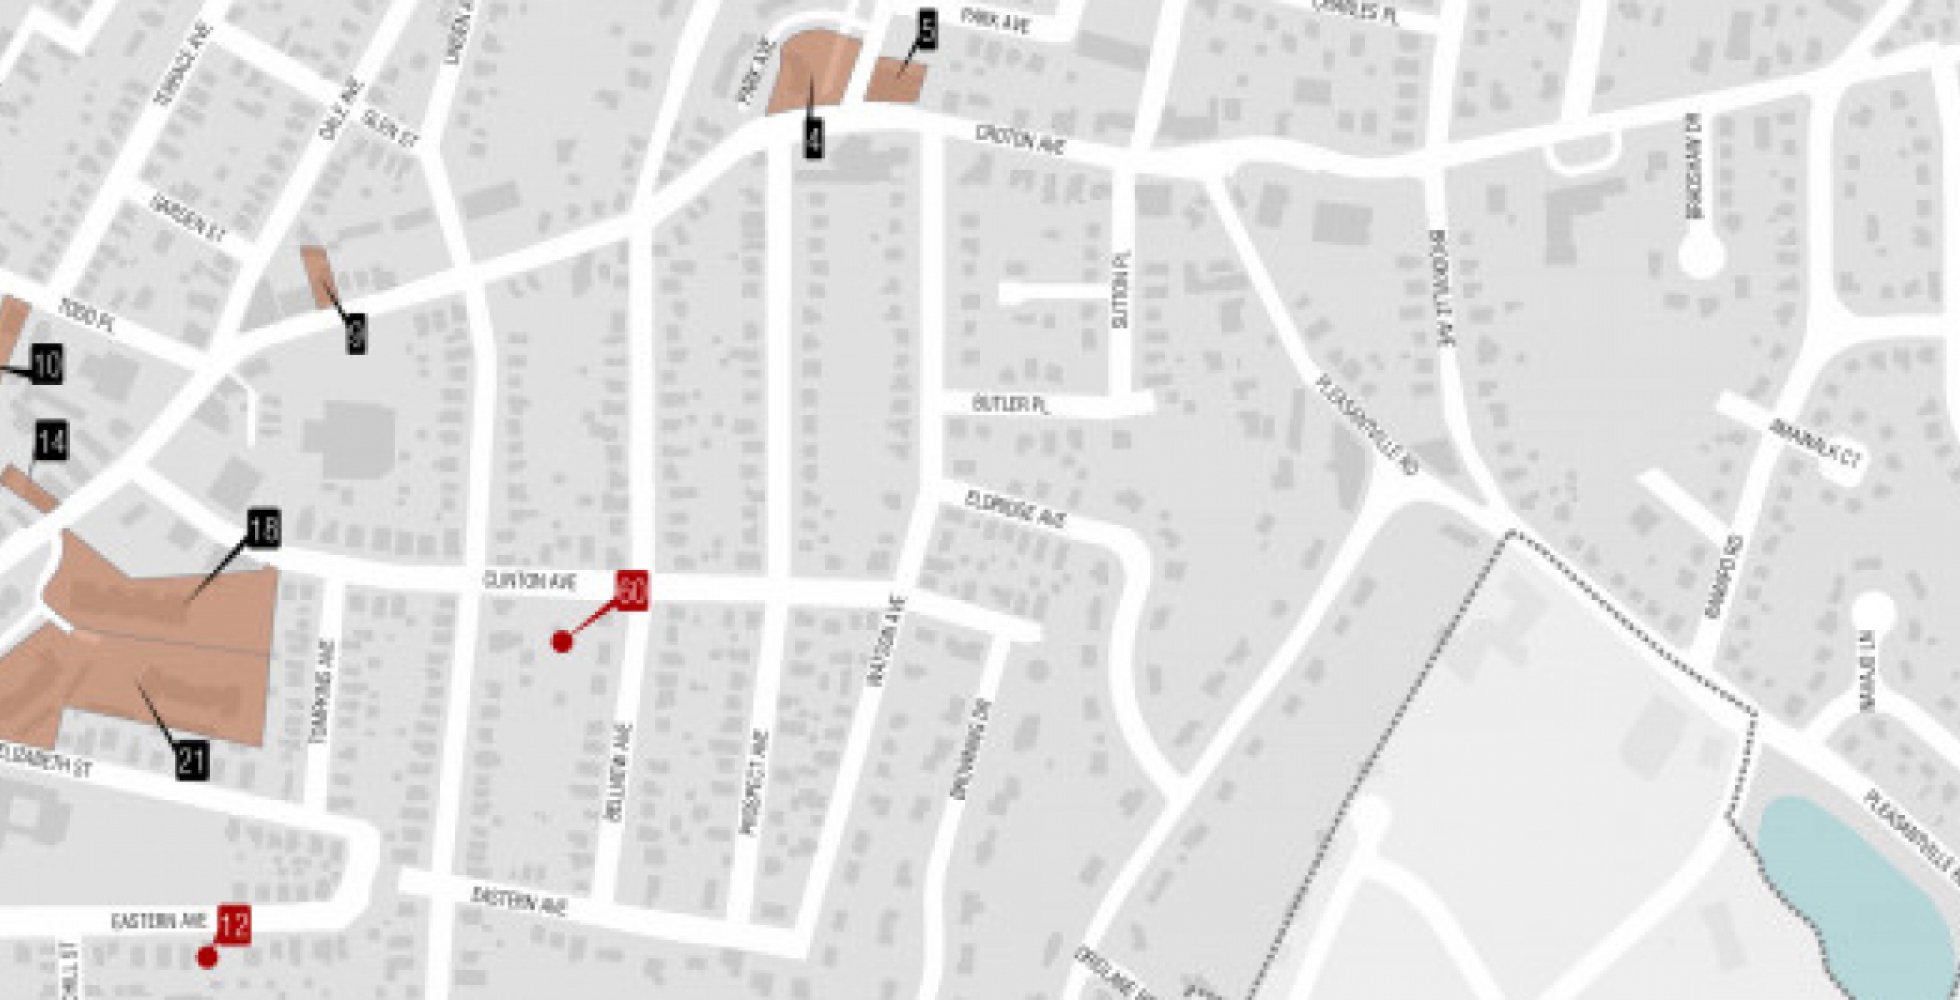
Collective for Community, Culture and the Environment for the Village of Ossining
The Collective for Community, Culture, and Environment for the Village of Ossining
The Collective for Community, Culture, and Environment (CCCE) was hired by the Village of Ossining to conduct an Analysis of the Housing Vacancy Rate in the Village in order to establish rent control for eligible parcels.