The Migrant Mortality Mapping Portal Project (M3P2) – A Humanitarian Data-Provision Project in Process
By Rachel Daniell
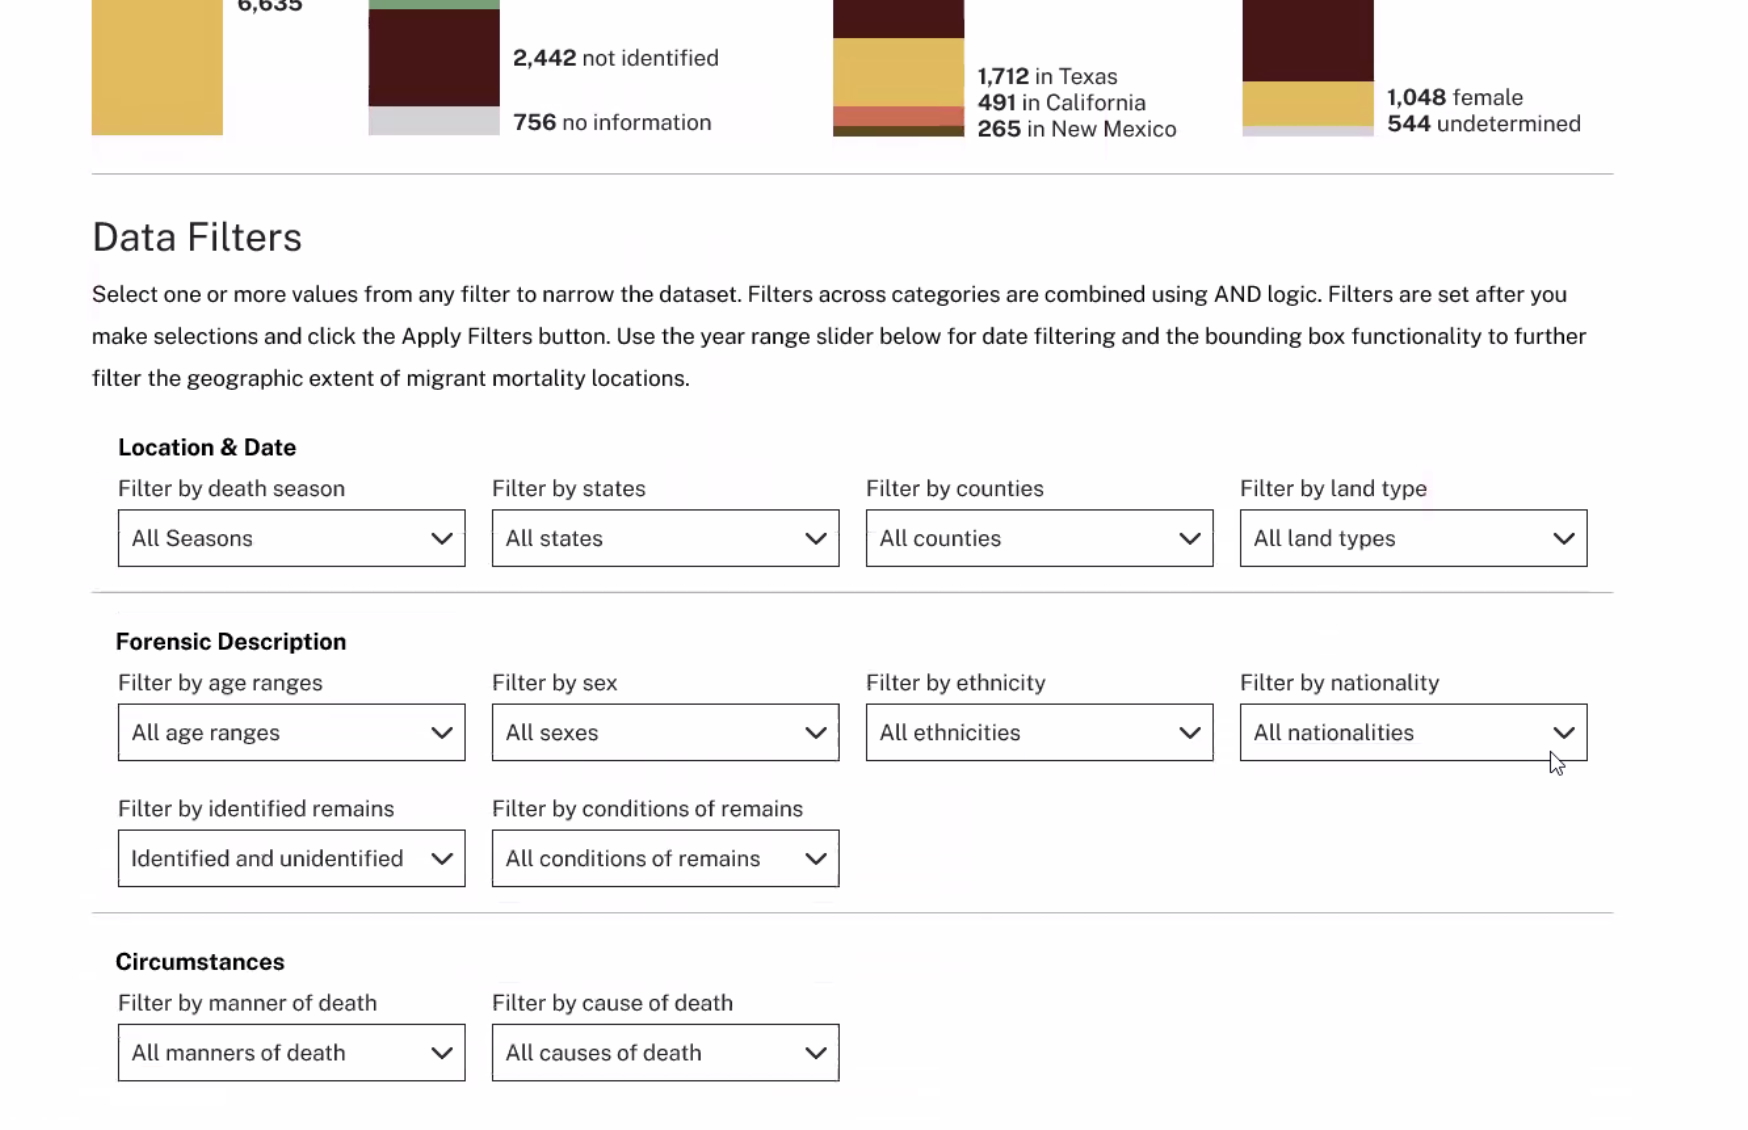
Over the last forty years a currently indeterminate number of persons, ranging from thousands to tens of thousands, have died along the US-Mexico border during migration, fleeing poverty, armed conflict, situations of violence, and disasters. An accurate accounting of migrant deaths along the southern US border is the first step toward an understanding of the extent and the contributing factors of these deaths. Reliable data, however, covering the full border are not currently available. While several governmental agencies and NGOs report figures documenting subsets of these deaths, the variable nature of these statistics indicate data sources face significant challenges. The creation of the Migrant Mortality Mapping Portal Project (M3P2), a website portal tool incorporating maps, summary statistics, and charts communicating data from multiple official medico-legal sources in one public online space, aims to add to the information available to better document these deaths and provide resources for forensic professionals, researchers, journalists, and potential advocates for family members of the missing and deceased.
In the Research Open House presentation, the web portal, currently in beta and scheduled to launch in September 2026, will be presented through static images. The research work process that has been required to gather, organize, and systematize the forensic data in order to render it in a format that can be worked with in aggregate and presented in mappable forms will be described. Significant project team decisions around aspects such as how the platform could best serve the needs of multiple users, the considerations of user experience in design, and working through data privacy and protections issues on a research project dealing with information about this humanitarian crisis will be discussed. Design decisions that emphasize providing robust accessibility to data, chart visualizations, and maps will be presented. Contributions of the Pratt Graduate Assistants to the project will also be highlighted as a demonstration of how information design and user experience considerations can be incorporated into a multi-institutional social science research endeavor.
-

Rachel Daniell
Rachel Daniell, PhD, is a Visiting Assistant Professor at Pratt School of Information. They are an interdisciplinary scholar interested in temporality, spatiality, documentation, and metadata as they intersect with human…