State of the Hudson

Can Sucuoglu
Sara Eichner, School of Information
SAVI (Spatial Analysis and Visualization Initiative)
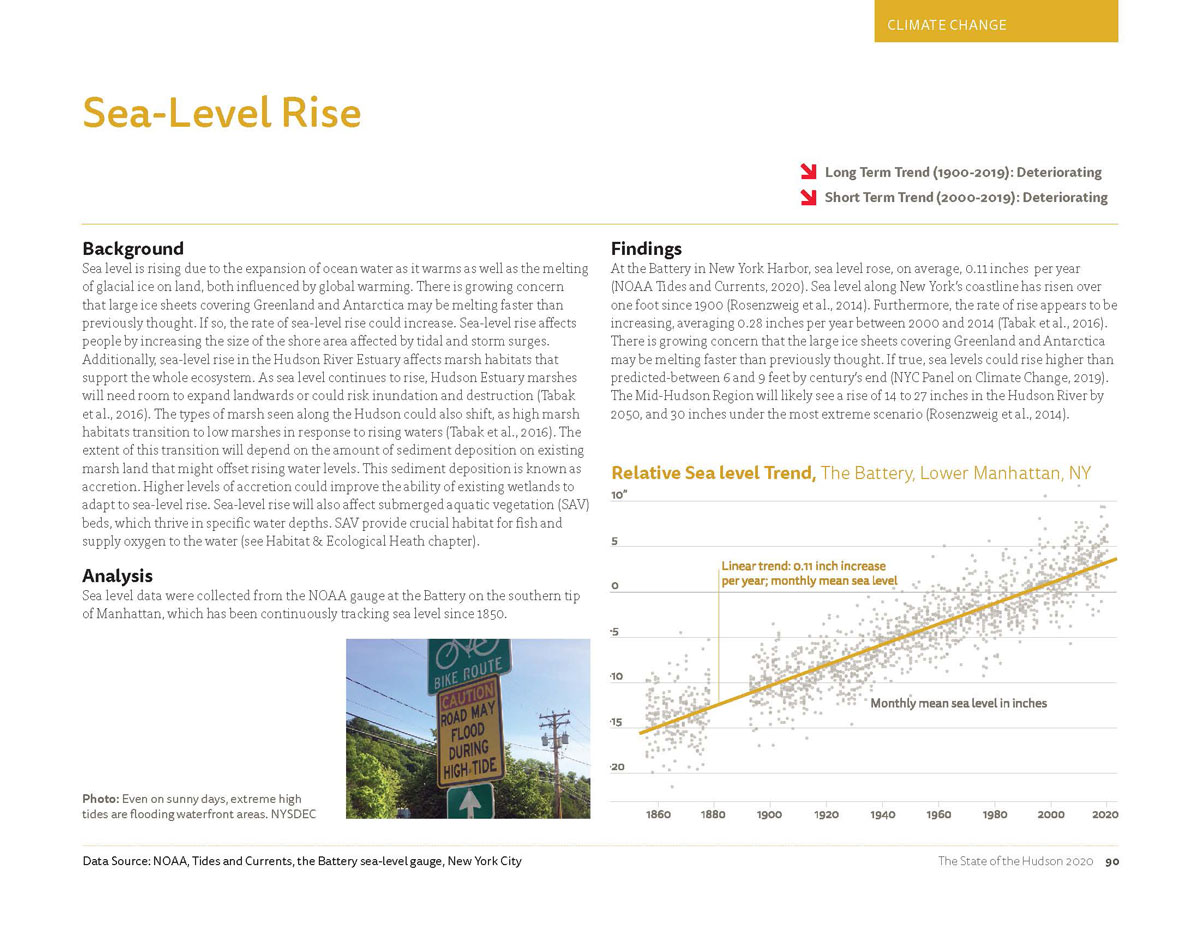
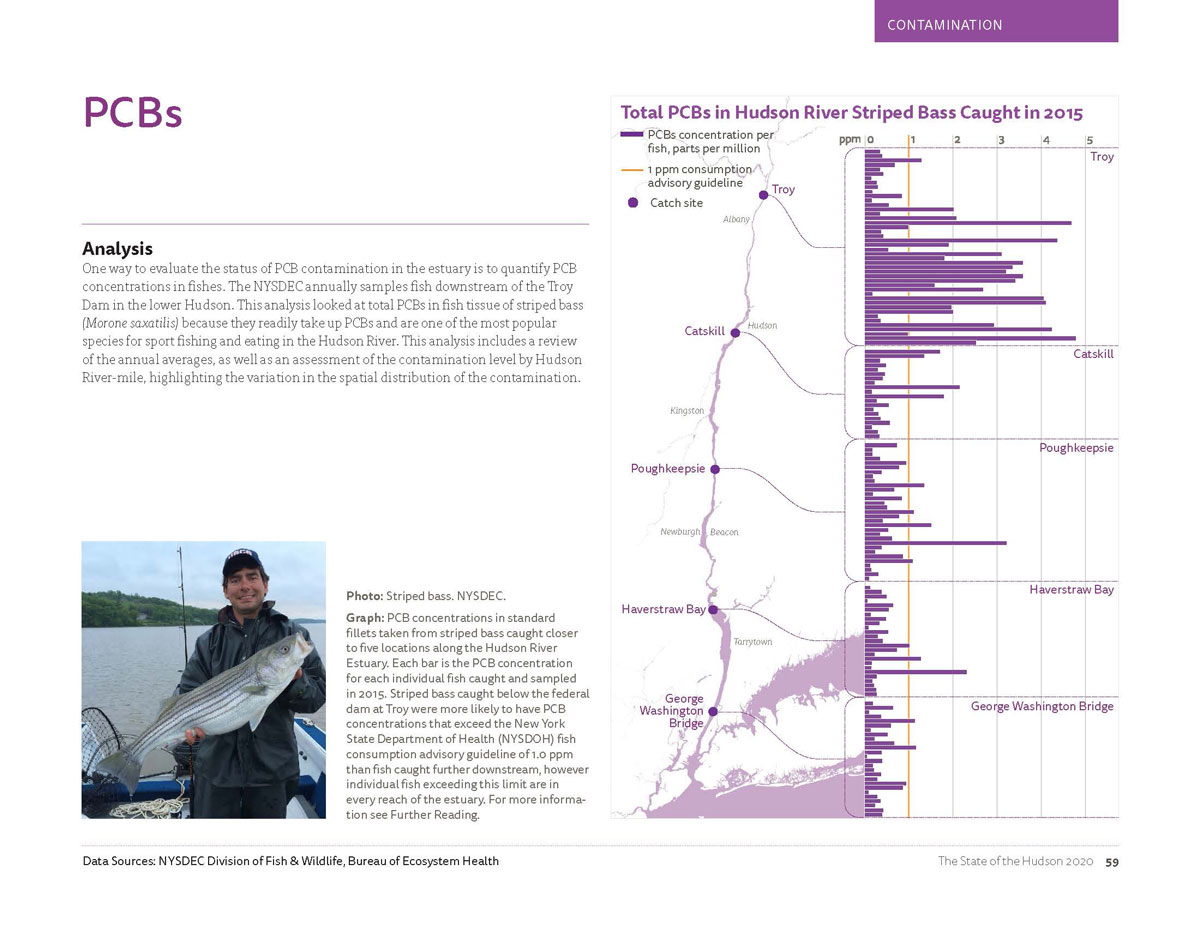
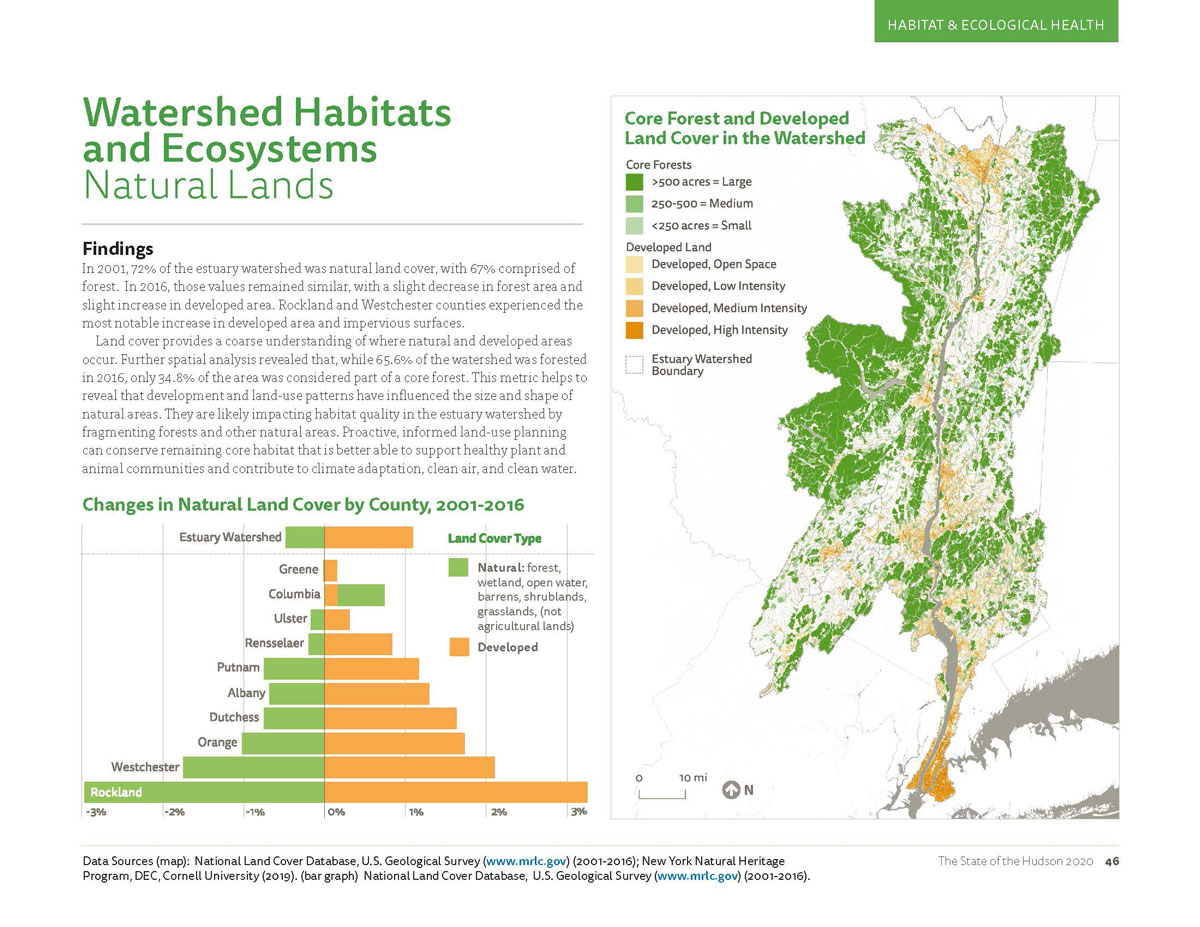
Understanding the changing conditions of the Hudson River and its Estuary requires a complex set of indicators. The water quality, health of fish and wildlife, amount and location of public access, and engagement of residents in stewardship activities tell us about these ecosystems and management needs.
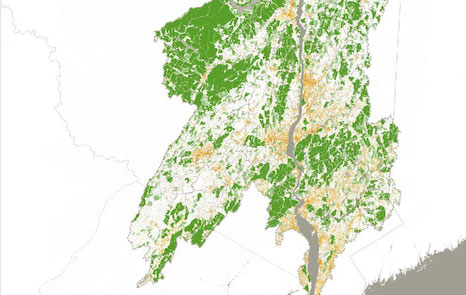
SAVI collaborated with scientists and stewards of the Hudson River to improve the communication of the scientific information to the general public.
Each map and chart was meticulously reviewed to enhance the readability while ensuring the integrity of data.
Each chapter (Water Quality, Habitat and Ecological Health, Contaminants, Public Access, Community Engagement, Climate Change.) in the report was given a specific color theme, which provided an easier reading experience for this densely packed and long report.
Link to the report: The State of the Hudson 2020


